Note
Click here to download the full example code
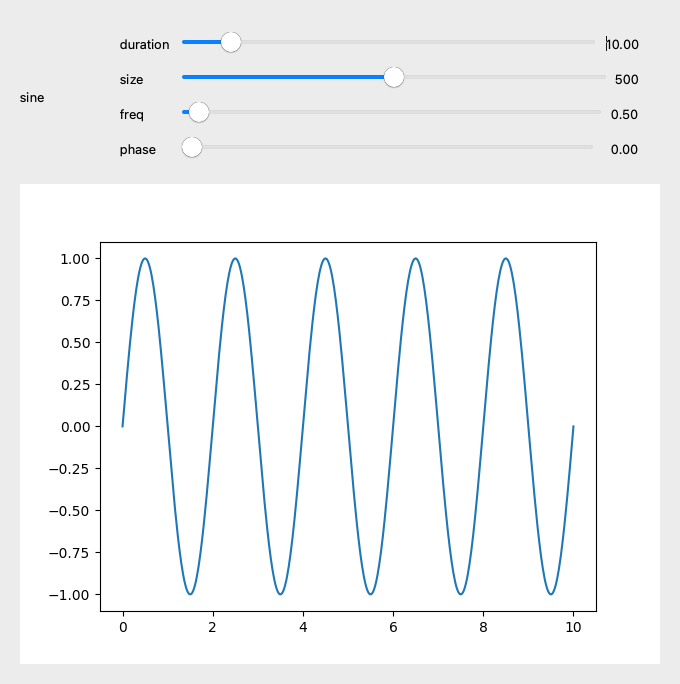
Waveforms example#
Simple waveform generator widget, with plotting.
Out:
<Container (signal_widget: NoneType, sine: NoneType)>
from dataclasses import dataclass, field
from enum import Enum
from functools import partial
from typing import Annotated
import matplotlib.pyplot as plt
import numpy as np
from matplotlib.backends.backend_qt5agg import FigureCanvas
try:
from scipy import signal
except ImportError:
raise ImportError("This example requires the scipy package. ")
from magicgui import magicgui, register_type, widgets
register_type(float, widget_type="FloatSlider")
register_type(int, widget_type="Slider")
Freq = Annotated[float, {"min": 0.001, "max": 30.0}]
Phase = Annotated[float, {"min": 0.0, "max": 360.0}]
Duty = Annotated[float, {"min": 0.0, "max": 1.0}]
Time = Annotated[float, {"min": 0.01, "max": 100.0}]
@dataclass
class Signal:
"""Constructs a 1D signal.
As is, this class is not very useful, but one could add callbacks
or more functionality here
Parameters
----------
func : callable
func must take a 'time' array as sole argument and return a 1D array with the
same size as the input
duration : float
the maximum of the input time array
size : int
the number of samples in the time array
"""
func: callable
duration: Time = 1.0
size: int = 500
time: np.ndarray = field(init=False)
data: np.ndarray = field(init=False)
def __post_init__(self):
"""Evaluate the function at instantiation time."""
self.time = np.linspace(0, self.duration, self.size)
self.data = self.func(self.time)
def plot(self, ax=None, **kwargs):
"""Plots the data.
Parameters
----------
ax: matplotlib.axes.Axes instance, default None
if provided the plot is done on this axes instance.
If None a new ax is created
**kwargs: Keyword arguments that are passed on to
the matplotib ax.plot method
Returns
-------
fig: a matplotlib.figure.Figure instance
ax: matplotlib.axes.Axes instance
"""
if ax is None:
fig, ax = plt.subplots()
else:
fig = ax.get_figure()
ax.plot(self.time, self.data, **kwargs)
return fig, ax
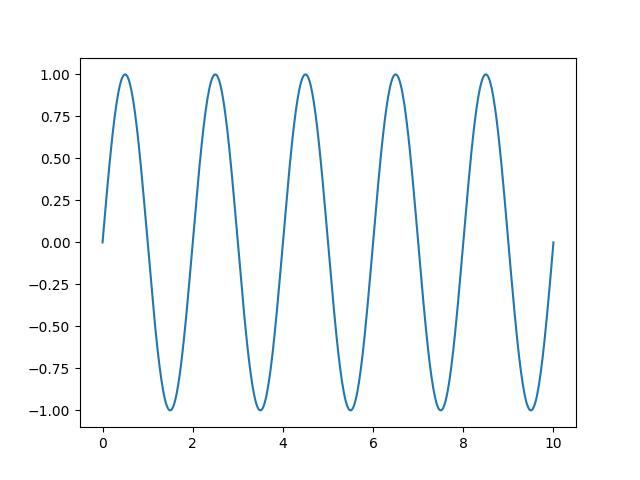
def sine(
duration: Time = 10.0, size: int = 500, freq: Freq = 0.5, phase: Phase = 0.0
) -> Signal:
"""Returns a 1D sine wave.
Parameters
----------
duration: float
the duration of the signal in seconds
size: int
the number of samples in the signal time array
freq: float
the frequency of the signal in Hz
phase: Phase
the phase of the signal (in degrees)
"""
sig = Signal(
duration=duration,
size=size,
func=lambda t: np.sin(t * (2 * np.pi * freq) + phase * np.pi / 180),
)
return sig
def chirp(
duration: Time = 10.0,
size: int = 500,
f0: float = 1.0,
t1: Time = 5.0,
f1: float = 2.0,
phase: Phase = 0.0,
) -> Signal:
"""Frequency-swept cosine generator.
See scipy.signal.chirp
"""
sig = Signal(
duration=duration,
size=size,
func=partial(signal.chirp, f0=f0, t1=t1, f1=f1, phi=phase),
)
return sig
def sawtooth(
duration: Time = 10.0,
size: int = 500,
freq: Freq = 1.0,
width: Duty = 1.0,
phase: Phase = 0.0,
) -> Signal:
"""Return a periodic sawtooth or triangle waveform.
See scipy.signal.sawtooth
"""
sig = Signal(
duration=duration,
size=size,
func=lambda t: signal.sawtooth(
2 * np.pi * freq * t + phase * np.pi / 180, width=width
),
)
return sig
def square(
duration: Time = 10.0, size: int = 500, freq: Freq = 1.0, duty: Duty = 0.5
) -> Signal:
"""Return a periodic sawtooth or triangle waveform.
See scipy.signal.square
"""
sig = Signal(
duration=duration,
size=size,
func=lambda t: signal.square(2 * np.pi * freq * t, duty=duty),
)
return sig
def on_off(
duration: Time = 10.0, size: int = 500, t_on: Time = 0.01, t_off: Time = 0.01
) -> Signal:
"""On/Off signal function."""
data = np.ones(size)
data[: int(size * t_on / duration)] = -1
if t_off > 0:
data[int(size * t_off / duration) :] = -1
sig = Signal(duration=duration, size=size, func=lambda t: data)
return sig
WAVEFORMS = {
"sine": sine,
"chirp": chirp,
"sawtooth": sawtooth,
"square": square,
"on_off": on_off,
}
class Select(Enum):
"""Enumeration to select signal type."""
OnOff = "on_off"
Sine = "sine"
Chirp = "chirp"
Sawtooth = "sawtooth"
Square = "square"
class WaveForm(widgets.Container):
"""Simple waveform generator widget, with plotting."""
def __init__(self):
"""Creates the widget."""
super().__init__()
self.fig, self.ax = plt.subplots()
self.native.layout().addWidget(FigureCanvas(self.fig))
self.waveform = sine
self.controls = None
self.append(self.signal_widget)
self.update_controls()
self.update_graph(sine())
@magicgui(auto_call=True)
def signal_widget(self, select: Select = Select.Sine) -> widgets.Container:
"""Waveform selection, from the WAVEFORMS dict."""
self.waveform = WAVEFORMS[select.value]
self.update_controls()
self.update_graph(self.waveform())
def update_controls(self):
"""Reset controls according to the new function."""
if self.controls is not None:
self.remove(self.controls)
self.controls = magicgui(auto_call=True)(self.waveform)
self.append(self.controls)
self.controls.called.connect(self.update_graph)
def update_graph(self, sig: Signal):
"""Re-plot when a parameter changes.
Note
----
For big data, this could be slow, maybe `auto_call` should
not be true in the method above...
"""
self.ax.cla()
sig.plot(ax=self.ax)
self.fig.canvas.draw()
waveform = WaveForm()
waveform.show(run=True)
Total running time of the script: ( 0 minutes 0.259 seconds)
Download Python source code: waveform.py