Note
Click here to download the full example code
matplotlib figure example#
Basic example of adding a generic QWidget to a container.
Main lesson: add your QWidget to container.native.layout() as shown on line 30

Out:
<FunctionGui f(position: int = 0)>
import matplotlib.pyplot as plt
import numpy as np
from matplotlib.backends.backend_qt5agg import FigureCanvas
from magicgui import magicgui
x = np.linspace(0, 5, 256)
y = np.linspace(0, 5, 256)[:, np.newaxis]
data = np.sin(x) ** 10 + np.cos(10 + y * x) * np.cos(x)
mpl_fig = plt.figure()
ax = mpl_fig.add_subplot(111)
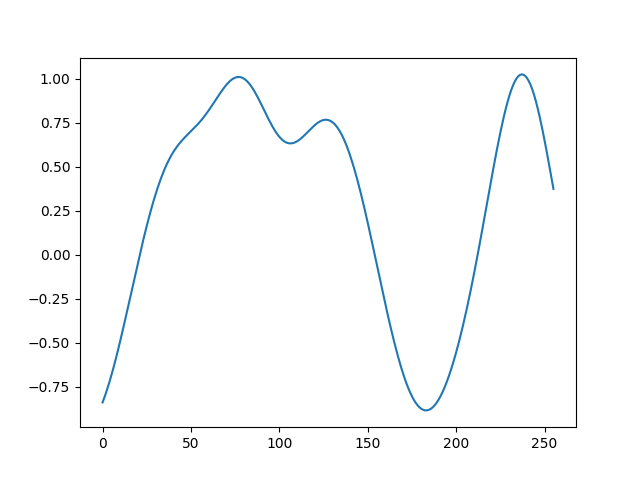
(line,) = ax.plot(data[123]) # linescan through the middle of the image
@magicgui(position={"widget_type": "Slider", "max": 255}, auto_call=True)
def f(position: int):
"""Function demonstrating magicgui combined with matplotlib."""
line.set_ydata(data[position])
line.figure.canvas.draw()
# rather than using the Container.append (`f.append`) ...
# grab the native layout and add the QWidget to it
f.native.layout().addWidget(FigureCanvas(mpl_fig))
f.show(run=True)
Total running time of the script: ( 0 minutes 0.132 seconds)
Download Python source code: mpl_figure.py