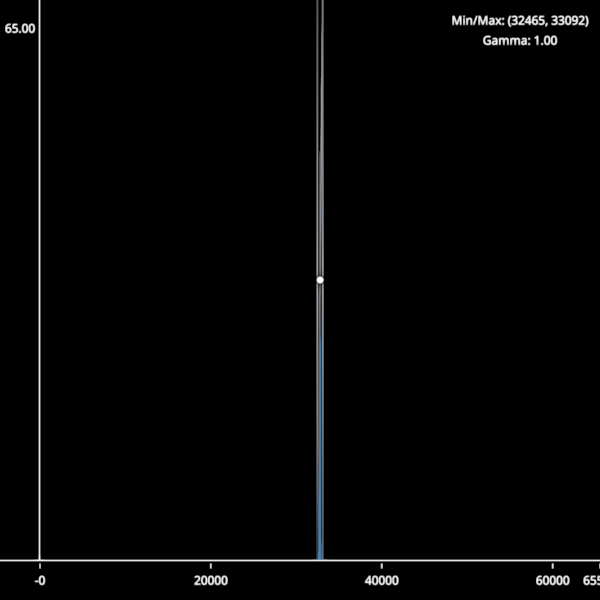
Histogram#
An interactive histogram.
from __future__ import annotations

from math import ceil, floor, log10
from typing import TYPE_CHECKING

import cmap
import numpy as np
import numpy.typing as npt

import scenex as snx
from scenex.app import CursorType, events
from scenex.utils import projections

if TYPE_CHECKING:
    from collections.abc import Sequence


def gaussian_dataset(
    n: int = 100000,
    mean: float = 32767.5,
    std: float = 80.0,
    dtype: np.dtype | None = None,
) -> np.ndarray:
    """Generate a gaussian-distributed dataset clipped to the given dtype range."""
    if dtype is None:
        dtype = np.dtype(np.uint16)
    info = np.iinfo(dtype)
    data = np.random.normal(mean, std, n)
    return np.clip(data, info.min, info.max).astype(dtype)


def _calc_hist_bins(data: np.ndarray) -> tuple[np.ndarray, np.ndarray]:
    maxval = np.iinfo(data.dtype).max
    counts = np.bincount(data.flatten(), minlength=maxval + 1)
    bin_edges = np.arange(maxval + 2) - 0.5
    return counts, bin_edges


_AXIS = 40  # pixels reserved for each axis strip
_LEGEND_W = 160  # legend width in pixels
_LEGEND_H = 50  # legend height in pixels


class Histogram:
    """A simple interactive histogram view with adjustable clims and gamma."""

    def __init__(self) -> None:
        self._clims: tuple[float, float] = (0, 65535)
        self._gamma = 1.0
        self._grabbed: snx.Node | None = None

        self._values: np.ndarray | None = None
        self._bins: np.ndarray | None = None

        # Canvas
        self.canvas = snx.Canvas(
            width=600,
            height=600,
            visible=True,
        )

        # -- Views -- ##

        # x-axis
        self.x_view = snx.View(
            scene=snx.Scene(name="x axis"),
            camera=snx.Camera(),
        )
        self.x_view.layout.y_start = f"-{_AXIS}px"
        self._init_x_view()
        self.canvas.views.append(self.x_view)

        # y-axis
        self.y_view = snx.View(
            scene=snx.Scene(name="y axis"),
            camera=snx.Camera(),
        )
        self.y_view.layout.x_end = f"{_AXIS}px"
        self.y_view.layout.y_end = f"-{_AXIS}px"
        self._init_y_view()
        self.canvas.views.append(self.y_view)

        # plot
        self.view = snx.View(
            scene=snx.Scene(name="main scene"),
            camera=snx.Camera(interactive=True),
        )
        self.view.layout.x_start = f"{_AXIS}px"
        self.view.layout.y_end = f"-{_AXIS}px"
        self._init_main_view()
        self.canvas.views.append(self.view)

        # legend
        self.legend_view = snx.View(
            scene=snx.Scene(name="legend"),
            camera=snx.Camera(),
        )
        self.legend_view.layout.background_color = cmap.Color((0, 0, 0, 0))
        self.legend_view.layout.x_start = f"-{_LEGEND_W}px"
        self.legend_view.layout.y_end = f"{_LEGEND_H}px"
        self._init_legend_view()
        self.canvas.views.append(self.legend_view)

    def _init_x_view(self) -> None:
        """Populate the x-axis view scene."""
        self.x_axis = snx.Line(
            vertices=np.array([[0, 0, 0], [1, 0, 0]]),
            width=2,
            color=snx.UniformColor(color=cmap.Color("white")),
        )
        self.x_view.scene.add_child(self.x_axis)
        self._tick_objects: list[snx.Text] = []

        # Pre-create 10 tick objects with line children (enough for min, max, and ticks)
        for _ in range(10):
            tick_line = snx.Line(
                vertices=np.array([[0, 0, 0], [0, -0.1, 0]]),
                width=1,
                color=snx.UniformColor(color=cmap.Color("white")),
                transform=snx.Transform().translated((0, 0.4, 0)),
            )
            tick_text = snx.Text(text="0", children=[tick_line], antialias=True)  # type: ignore
            self._tick_objects.append(tick_text)

    def _init_y_view(self) -> None:
        """Populate the y-axis view scene."""
        self.y_axis = snx.Line(
            vertices=np.array([[0, 0, 0], [0, 1, 0]]),
            width=2,
            color=snx.UniformColor(color=cmap.Color("white")),
        )
        self.y_max = snx.Text(
            text="1", transform=snx.Transform().translated((-0.5, 0.95)), antialias=True
        )
        self.y_view.scene.add_child(self.y_axis)
        self.y_view.scene.add_child(self.y_max)

    def _init_legend_view(self) -> None:
        """Populate the legend view with clim/gamma text."""
        self.legend_clims = snx.Text(antialias=True)
        self.legend_gamma = snx.Text(antialias=True)

        self.legend_clims.transform = snx.Transform().translated((0.5, 0.6, 0))
        self.legend_gamma.transform = snx.Transform().translated((0.5, 0.2, 0))

        self.legend_view.scene.add_child(self.legend_clims)
        self.legend_view.scene.add_child(self.legend_gamma)
        self._update_legend()

    def _update_legend(self) -> None:
        """Refresh legend text to reflect current clims and gamma."""
        lo, hi = self._clims
        self.legend_clims.text = f"Min/Max: ({lo:.0f}, {hi:.0f})"
        self.legend_gamma.text = f"Gamma: {self._gamma:.2f}"

    def _init_main_view(self) -> None:
        """Populate the main histogram view scene and connect event handlers."""
        self.mesh = snx.Mesh(
            vertices=np.zeros((1, 3), dtype=np.float32),
            faces=np.zeros((1, 3), dtype=np.uint16),
            color=snx.UniformColor(color=cmap.Color("steelblue")),
            order=0,
        )

        # Split LUT line into three interactive components
        self.left_clim = snx.Line(
            name="left clim",
            interactive=True,
            order=1,
        )
        self.gamma_curve = snx.Line(
            name="gamma curve",
            interactive=False,
            order=1,
        )
        self.right_clim = snx.Line(
            name="right clim",
            interactive=True,
            order=1,
        )
        self.gamma_handle = snx.Points(
            name="gamma handle",
            vertices=np.array([[0.5, 0.5, 0]]),
            size=8,
            scaling="fixed",
            face_color=snx.UniformColor(color=cmap.Color("white")),
            edge_color=snx.UniformColor(color=cmap.Color("black")),
            interactive=True,
            order=2,
        )

        self._create_static_clim_lines()
        self._update_lut_line()

        self.controls = snx.Scene(
            name="controls scene",
            children=[
                self.left_clim,
                self.gamma_curve,
                self.right_clim,
                self.gamma_handle,
            ],
            interactive=True,
        )

        # Draw order (from bottom to top):
        # 0: histogram mesh
        self.mesh.order = 0
        self.view.scene.add_child(self.mesh)
        # 1: controls (clim lines, gamma curve, handle)
        self.controls.order = 1
        self.view.scene.add_child(self.controls)

        # Set up event handlers and controllers
        self.view.camera.controller = snx.PanZoom(lock_y=True)

        self.view.camera.events.transform.connect(self._update_x_axis)
        self.view.camera.events.projection.connect(self._update_x_axis)
        self.canvas.events.width.connect(self._update_x_axis)
        self.view.set_event_filter(self._on_main_view)

    def _on_main_view(self, event: events.Event) -> bool:
        # If we have a mouse event...
        if isinstance(event, events.MouseEvent):
            # ... on a view ...
            if not (ray := self.view.to_ray(event.pos)):
                return False
            # ... and are pressing a control, start a drag
            if isinstance(event, events.MousePressEvent):
                intersections = [
                    node
                    for node, _dist in ray.intersections(self.controls)
                    if node.interactive
                ]
                if len(intersections):
                    self._grabbed = intersections[0]
                    self.view.camera.interactive = False
            # ... and are double-pressing the gamma handle, reset the gamma
            elif isinstance(event, events.MouseDoublePressEvent):
                if (
                    ray.intersections(self.gamma_handle)
                    and self.gamma_handle.interactive
                ):
                    self.set_gamma(1.0)
            # ... and are moving, continue a drag ...
            if isinstance(event, events.MouseMoveEvent):
                if self._grabbed is self.left_clim:
                    # The left clim must stay to the left of the right clim
                    new_left = min(ray.origin[0], self._clims[1])
                    # ...and no less than the minimum value
                    if self._bins is not None:
                        new_left = max(new_left, self._bins[0])
                    self.set_clims((new_left, self._clims[1]))
                elif self._grabbed is self.right_clim:
                    # The right clim must stay to the right of the left clim
                    new_right = max(self._clims[0], ray.origin[0])
                    # ...and no more than the maximum value
                    if self._bins is not None:
                        new_right = min(new_right, self._bins[-1])
                    self.set_clims((self._clims[0], new_right))
                elif self._grabbed is self.gamma_handle:
                    self.set_gamma(-np.log2(ray.origin[1]))
                elif self._grabbed is None:
                    intersections = [
                        node
                        for node, _dist in ray.intersections(self.controls)
                        if node.interactive
                    ]
                    if (
                        self.right_clim in intersections
                        or self.left_clim in intersections
                    ):
                        snx.set_cursor(self.canvas, CursorType.H_ARROW)
                    elif self.gamma_handle in intersections:
                        snx.set_cursor(self.canvas, CursorType.V_ARROW)
                    else:
                        snx.set_cursor(self.canvas, CursorType.DEFAULT)

        # If we have a mouse release or leave event, end any drag
        if isinstance(event, events.MouseReleaseEvent | events.MouseLeaveEvent):
            self._grabbed = None
            self.view.camera.interactive = True
        return False

    def set_clims(self, clims: tuple[float, float]) -> None:
        """Set the histogram clims."""
        self._clims = clims
        self.controls.transform = (
            snx.Transform()
            .scaled((self._clims[1] - self._clims[0], 1, 1))
            .translated((self._clims[0], 0, 0))
        )
        self._update_legend()

    def set_gamma(self, gamma: float) -> None:
        """Set the gamma."""
        self._gamma = gamma
        self._update_lut_line()
        self._update_legend()

    def _create_static_clim_lines(self) -> None:
        """Create the static left and right clim lines that don't change with gamma."""
        # Left clim line (vertical line)
        left_x = np.array([0, 0, 0])
        left_y = np.array([1, 0.5, 0])
        left_z = np.zeros(3)
        self.left_clim.vertices = np.column_stack((left_x, left_y, left_z))

        # Right clim line (vertical line)
        right_x = np.array([1, 1, 1])
        right_y = np.array([1, 0.5, 0])
        right_z = np.zeros(3)
        self.right_clim.vertices = np.column_stack((right_x, right_y, right_z))

        # Color the clim lines
        dark_clim_color = cmap.Color((0.4, 0.4, 0.4))
        light_clim_color = cmap.Color((0.7, 0.7, 0.7))
        self.left_clim.color = snx.VertexColors(
            color=[dark_clim_color, light_clim_color, dark_clim_color],
        )
        self.right_clim.color = snx.VertexColors(
            color=[dark_clim_color, light_clim_color, dark_clim_color],
        )

    def _update_lut_line(self) -> None:
        """Updates the gamma curve vertices and colors."""
        npoints = 256
        # Gamma curve (non-interactive) - updates when gamma changes
        gamma_x = np.linspace(0, 1, npoints)
        gamma_y = np.linspace(0, 1, npoints) ** self._gamma
        gamma_z = np.zeros(npoints)
        self.gamma_curve.vertices = np.column_stack((gamma_x, gamma_y, gamma_z))

        # Gamma curve gets gradient colors
        gamma_colors = [
            cmap.Color(c)
            for c in np.linspace(0.2, 0.8, npoints).repeat(3).reshape(-1, 3)
        ]
        self.gamma_curve.color = snx.VertexColors(color=gamma_colors)
        self.gamma_handle.transform = snx.Transform().translated(
            (0, 0.5**self._gamma - 0.5)
        )

    def set_data(self, source: np.ndarray) -> None:
        """Set the histogram data."""
        values, bin_edges = _calc_hist_bins(source)
        first_data = self._values is None
        self._values = values
        self._bins = bin_edges
        self.mesh.vertices, self.mesh.faces = self._hist_counts_to_mesh(
            values, bin_edges
        )
        self._update_y_axis()
        if first_data:
            self.set_range()

    def set_range(self) -> None:
        """Sets the range of the x axis."""
        projections.zoom_to_fit(self.view, "orthographic", zoom_factor=1)
        self.x_view.camera.projection = projections.orthographic(1, 1, 1)
        self.y_view.camera.projection = projections.orthographic(1, 1, 1)
        # FIXME: Vispy doesn't render the lines if they're on the edge.
        self.x_view.camera.transform = snx.Transform().translated((0.5, -0.5, 0))
        self.y_view.camera.transform = snx.Transform().translated((-0.5, 0.5, 0))
        self.legend_view.camera.projection = projections.orthographic(1, 1, 1)
        self.legend_view.camera.transform = snx.Transform().translated((0.5, 0.5, 0))

    def _calculate_tick_step(
        self, min_val: float, max_val: float, target_ticks: int = 5
    ) -> float:
        """Calculate a nice tick step for the given range."""
        if max_val <= min_val:
            return 1.0

        range_val = max_val - min_val
        approx_step = range_val / target_ticks

        # Find a "nice" step size
        power10 = 10.0 ** floor(log10(approx_step))
        for multiplier in [1.0, 2.0, 2.5, 5.0, 10.0]:
            step = multiplier * power10
            if step >= approx_step:
                return step

        return power10

    def _get_tick_positions(
        self, min_val: float, max_val: float, step: float
    ) -> list[float]:
        """Get tick positions within range, including min/max and culling overlaps."""
        if step <= 0:
            return [min_val, max_val]

        # Calculate intermediate tick positions
        first_tick = ceil(min_val / step) * step
        last_tick = floor(max_val / step) * step

        intermediate_ticks: list[float] = []
        current = first_tick
        while current <= last_tick and len(intermediate_ticks) < 20:  # Safety limit
            intermediate_ticks.append(current)
            current += step

        # Filter out ticks too close to min/max to avoid overlap
        min_distance = step * 0.15
        filtered_ticks = [
            t
            for t in intermediate_ticks
            if abs(t - min_val) >= min_distance and abs(t - max_val) >= min_distance
        ]

        # Always include min and max, deduplicate while preserving order
        seen: set[float] = set()
        unique_ticks: list[float] = []
        for tick in [min_val, *filtered_ticks, max_val]:
            if tick not in seen:
                seen.add(tick)
                unique_ticks.append(tick)

        return unique_ticks

    def _clear_ticks(self) -> None:
        """Remove all existing tick marks and labels from the scene."""
        for tick_obj in self._tick_objects:
            if tick_obj in self.x_view.scene.children:
                self.x_view.scene.remove_child(tick_obj)

    def _update_x_axis(self) -> None:
        # Update the x-axis labels based on the current camera projection
        cam = self.view.camera
        left, *_others = cam.transform.map(cam.projection.imap((-1, 0)))
        right, *_others = cam.transform.map(cam.projection.imap((1, 0)))

        # Clear existing ticks and labels
        self._clear_ticks()

        # Calculate tick positions (includes min/max and culling logic)
        tick_step = self._calculate_tick_step(left, right)
        unique_positions = self._get_tick_positions(left, right, tick_step)

        _x, _y, w, _h = self.canvas.rect_for(self.x_view)
        start = _AXIS / w

        # Use cached tick objects for all positions
        for tick_idx, tick_val in enumerate(unique_positions):
            if tick_idx >= len(self._tick_objects):
                break

            # Calculate normalized position (0.1 to 0.95 maps to left to right)
            norm_pos = (
                start + (tick_val - left) / (right - left) * (1 - start)
                if right != left
                else 0.5
            )
            # Reuse pre-created tick object
            tick_obj = self._tick_objects[tick_idx]
            tick_obj.text = f"{tick_val:.0f}"
            tick_obj.transform = snx.Transform().translated((norm_pos, -0.5, 0))

            # Add to scene
            self.x_view.scene.add_child(tick_obj)

    def _update_y_axis(self) -> None:
        max_val = self.mesh.bounding_box[1][1]
        # Scale the y-axis to [0, 1]
        self.mesh.transform = snx.Transform().scaled((1, 0.95 / max(max_val, 1), 1))
        # Resize the y-axis against the new data
        self.y_max.text = f"{max_val:.2f}"

    def _hist_counts_to_mesh(
        self,
        values: Sequence[float] | npt.NDArray,
        bin_edges: Sequence[float] | npt.NDArray,
    ) -> tuple[npt.NDArray[np.float32], npt.NDArray[np.uint32]]:
        """Convert histogram counts to mesh vertices and faces for plotting."""
        n_edges = len(bin_edges)

        #   4-5
        #   | |
        # 1-2/7-8
        # |/| | |
        # 0-3-6-9
        # construct vertices
        # TODO: Reusing the arrays would be nice.
        vertices = np.zeros((3 * n_edges - 2, 3), np.float32)
        vertices[:, 0] = np.repeat(bin_edges, 3)[1:-1]
        vertices[1::3, 1] = values
        vertices[2::3, 1] = values
        vertices[vertices == float("-inf")] = 0

        # construct triangles
        faces = np.zeros((2 * n_edges - 2, 3), np.uint32)
        offsets = 3 * np.arange(n_edges - 1, dtype=np.uint32)[:, np.newaxis]
        faces[::2] = np.array([0, 2, 1]) + offsets
        faces[1::2] = np.array([2, 0, 3]) + offsets
        return vertices, faces


# Create the histogram
histogram = Histogram()
# Show the histogram
snx.show(histogram.canvas)
# Add some data
data = gaussian_dataset(n=10000)
histogram.set_data(data)
histogram.set_clims((data.min(), data.max()))
# Run!
snx.run()